Blog

Is It a Good Time to Buy a Home?

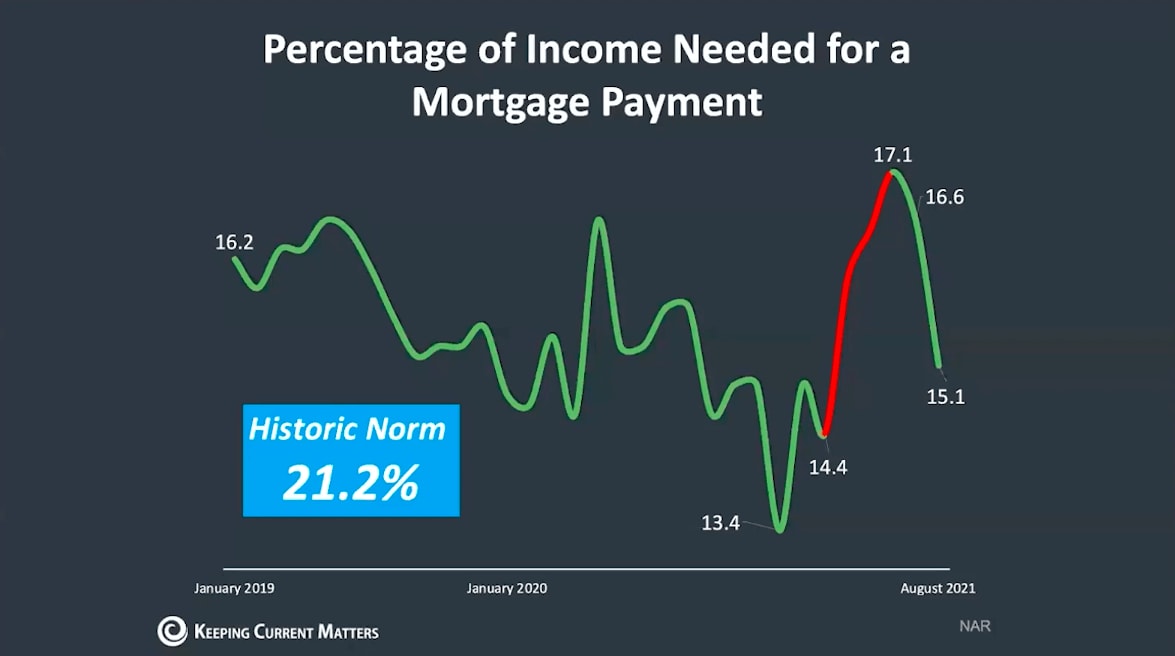
Many of my friends and clients have asked me recently whether or not now is a good time to buy a home. The most common headline we are seeing is that competition and housing prices are at an all time high. But digging deeper than the headlines, it's important to note that housing affordability is actually below historic norms! 

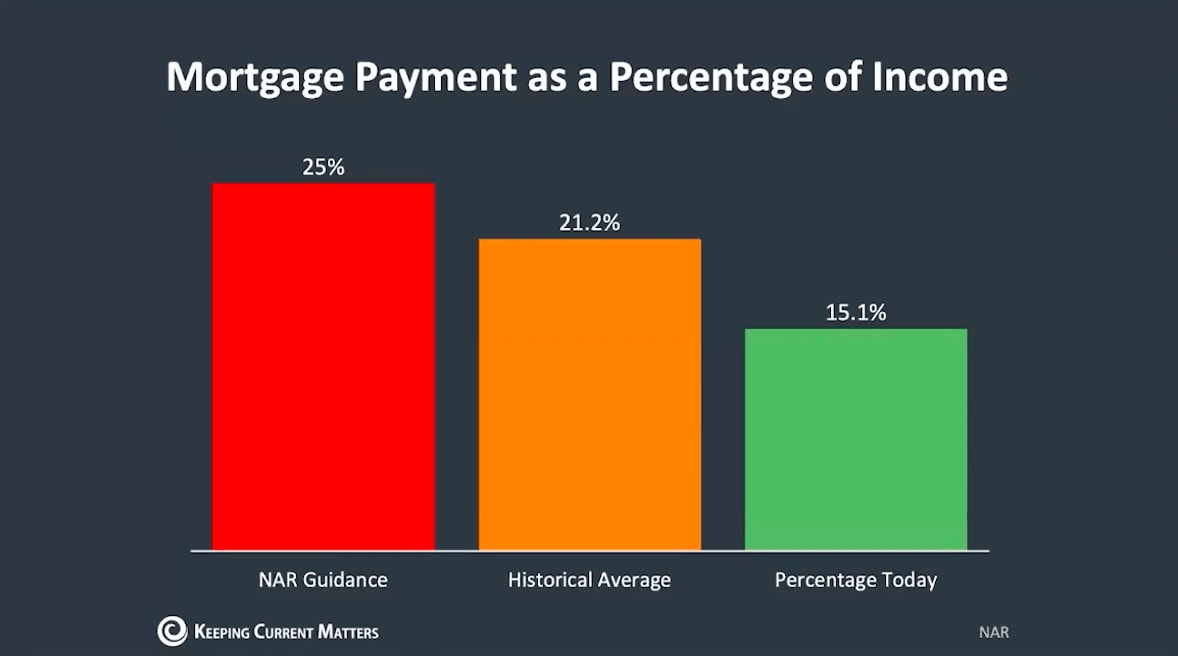
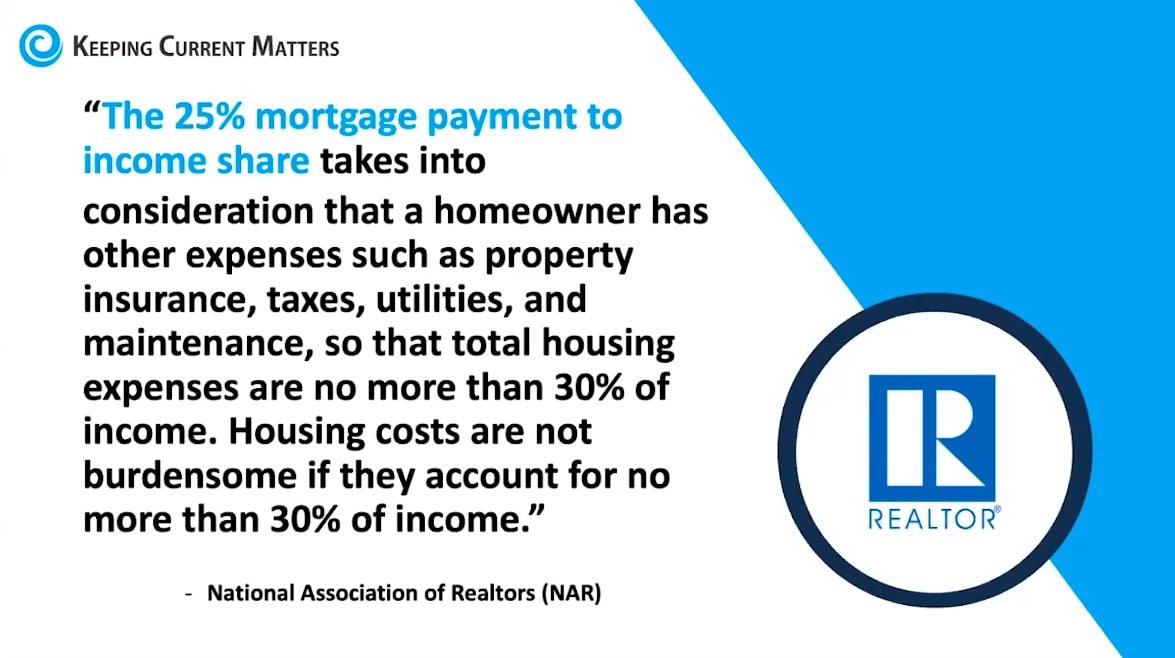
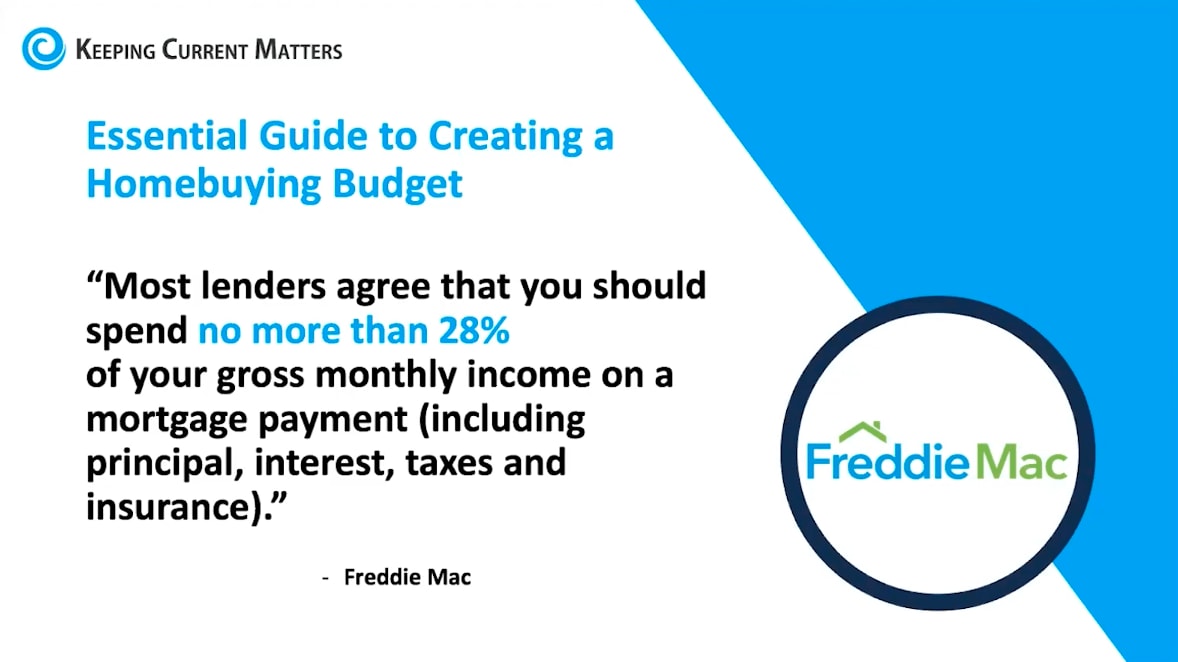
What does this mean? Most lenders agree that you should spend no more than 28% of your gross monthly income on a mortgage payment (Freddie Mac). Housing costs are not considered burdensome if they account for no more than 30% of your income. As you can see in the chart above, today's average is around 15.1%.

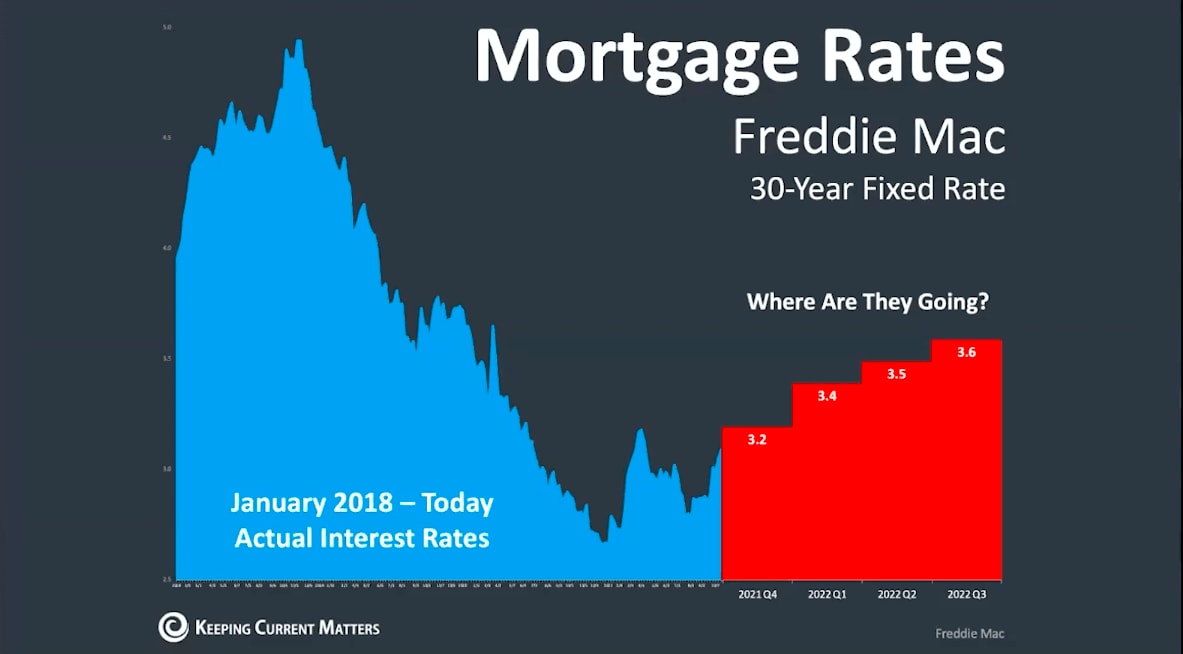
As interest rates increase in the coming months and years, affordability will actually get worse than it is now. If you're currently renting or thinking about upgrading your home, now is the time to start building equity!

- Kathleen
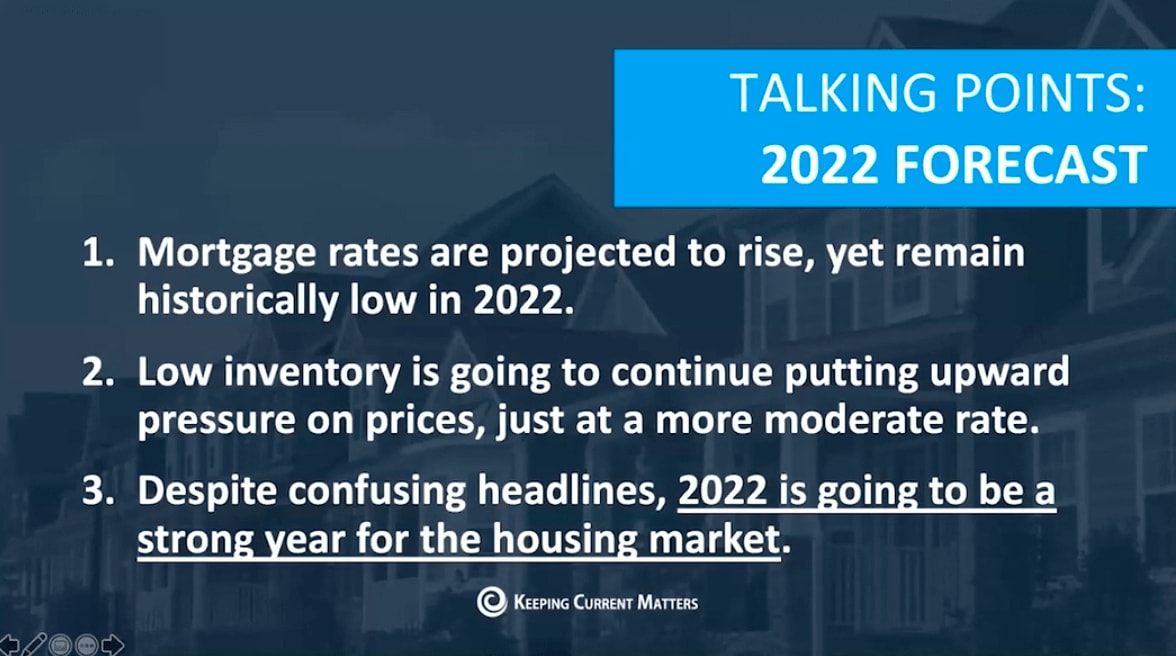
 

2022 housing forecast: rates rise but remain low, inventory keeps prices rising moderately, and the market remains strong.

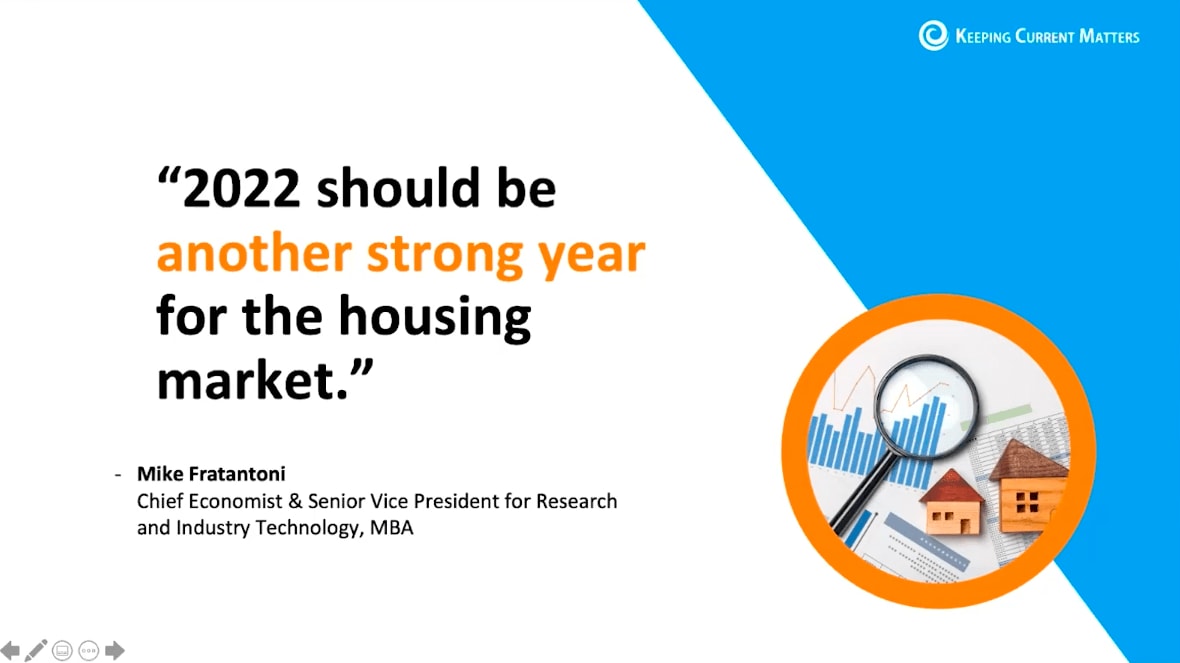
Housing-market graphic quoting Mike Fratantoni on expectations for 2022.

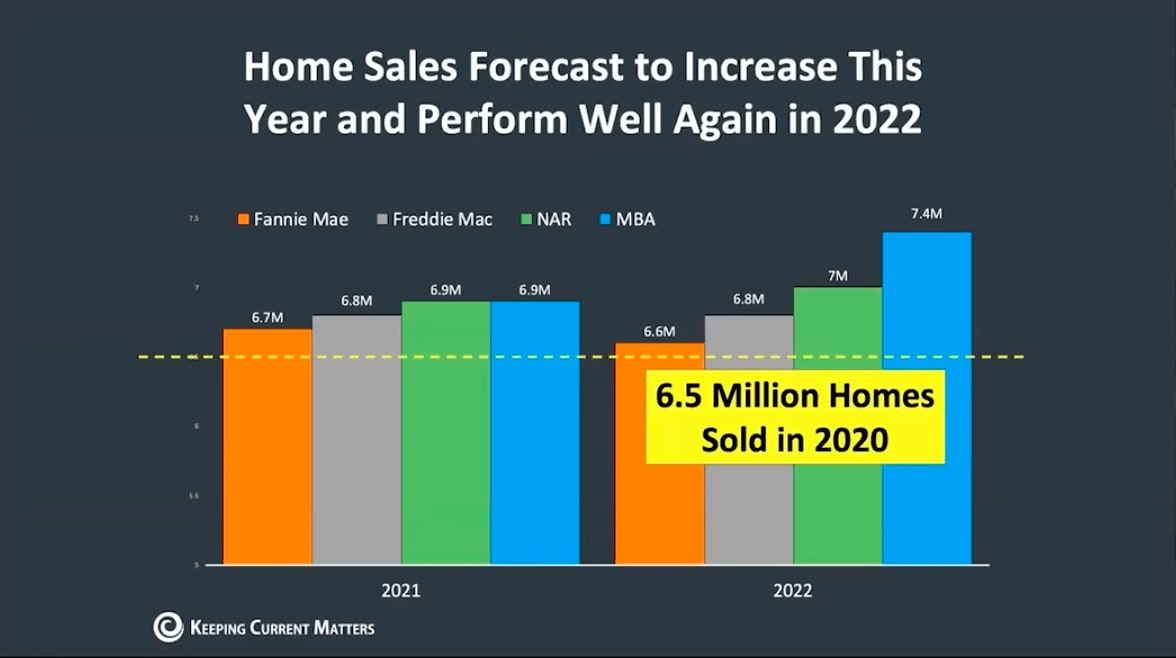
Chart compares 2021 and 2022 home sales forecasts from four organizations, with 2020 sales marked at 6.5 million.

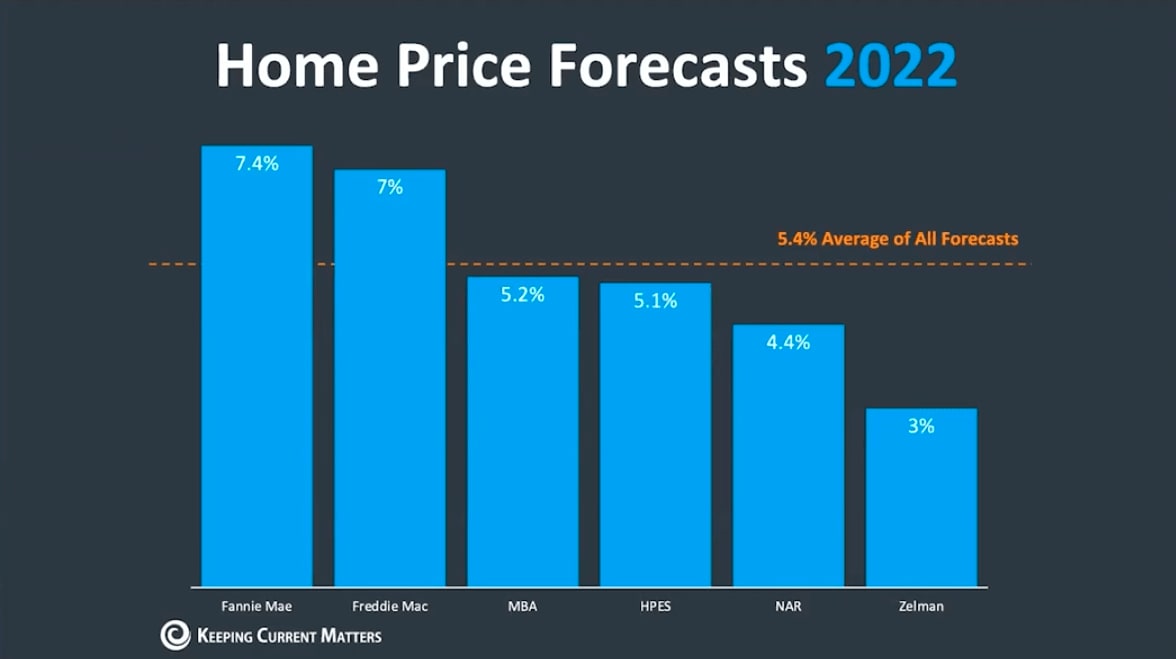
2022 home price forecast chart: Fannie Mae 7.4%, Freddie Mac 7%, MBA 5.2%, HPES 5.1%, NAR 4.4%, Zelman 3%.

Chart of Freddie Mac 30-year mortgage rates, with historical rates and a forecast rising through 2022.

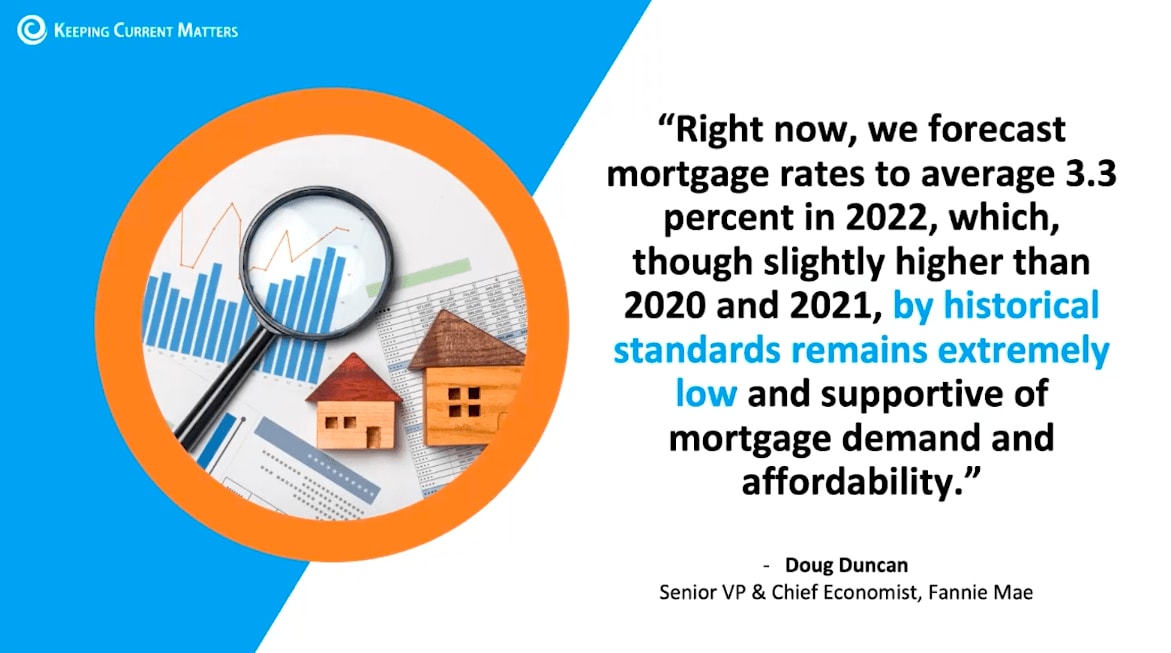
Mortgage rate forecast quote from Doug Duncan, illustrated with charts, a magnifying glass, and two houses.

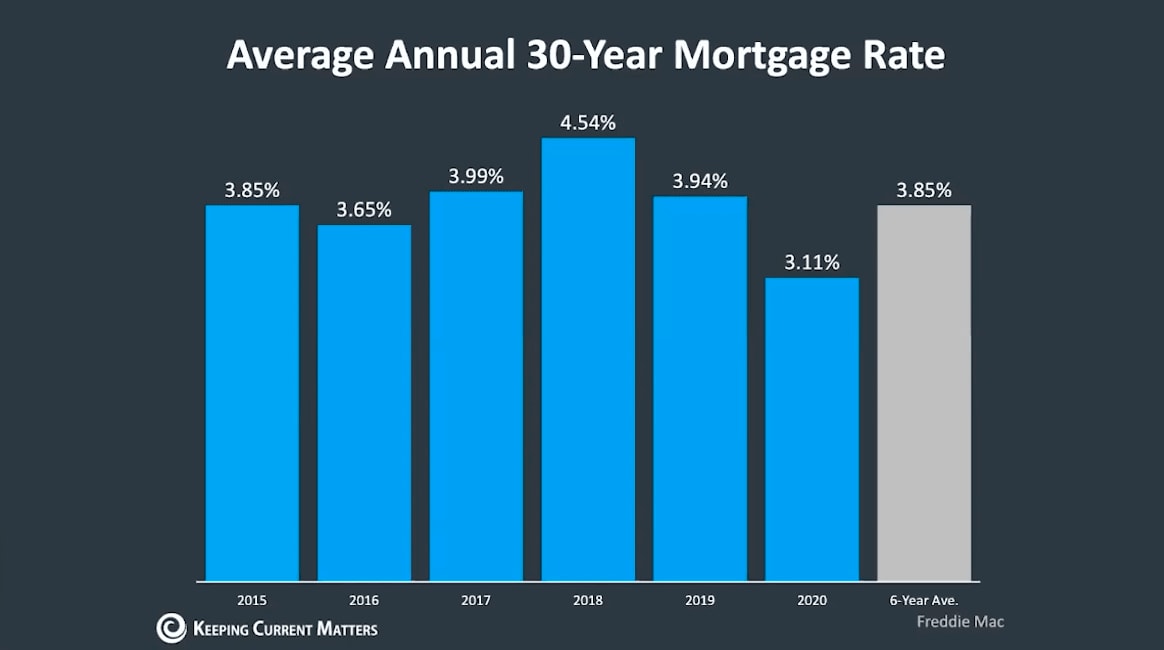
Chart of average annual 30-year mortgage rates from 2015 to 2020, with a six-year average of 3.85%.

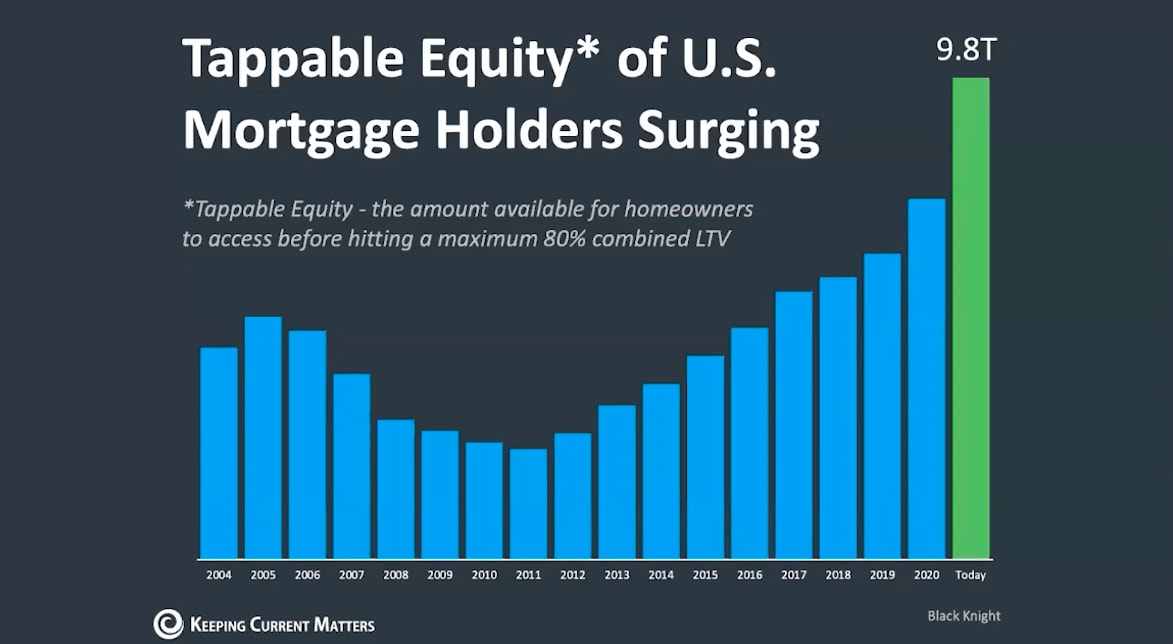
Chart shows U.S. mortgage holders’ tappable equity rising to 9.8T today.

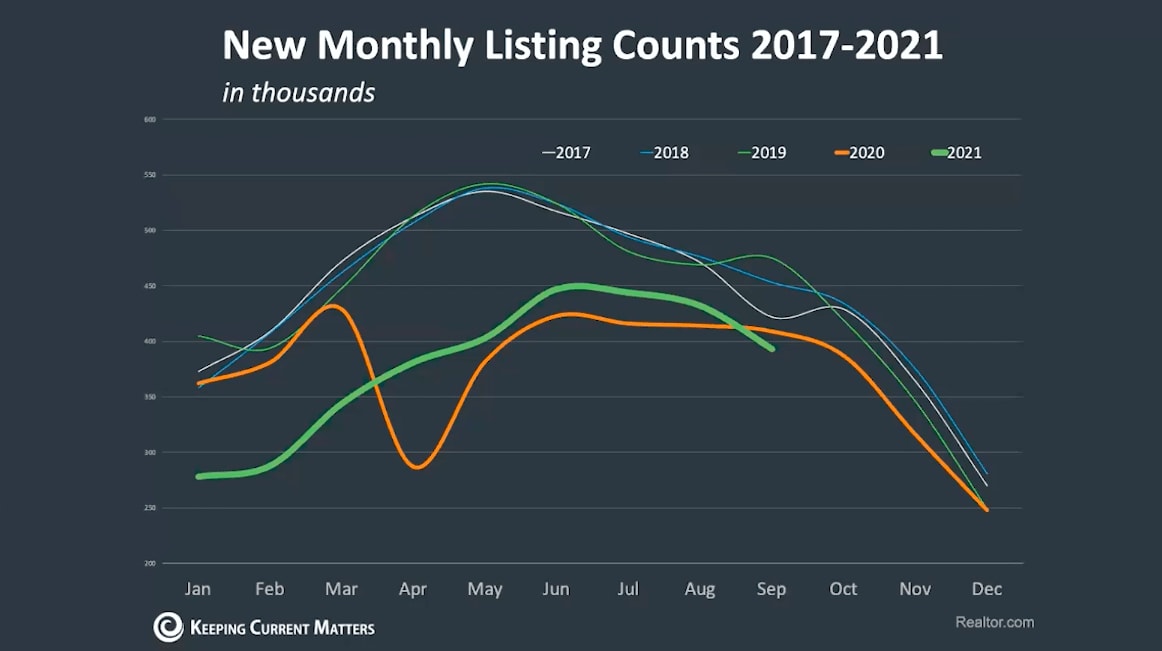
Line chart comparing monthly home listing counts from 2017 to 2021, measured in thousands.

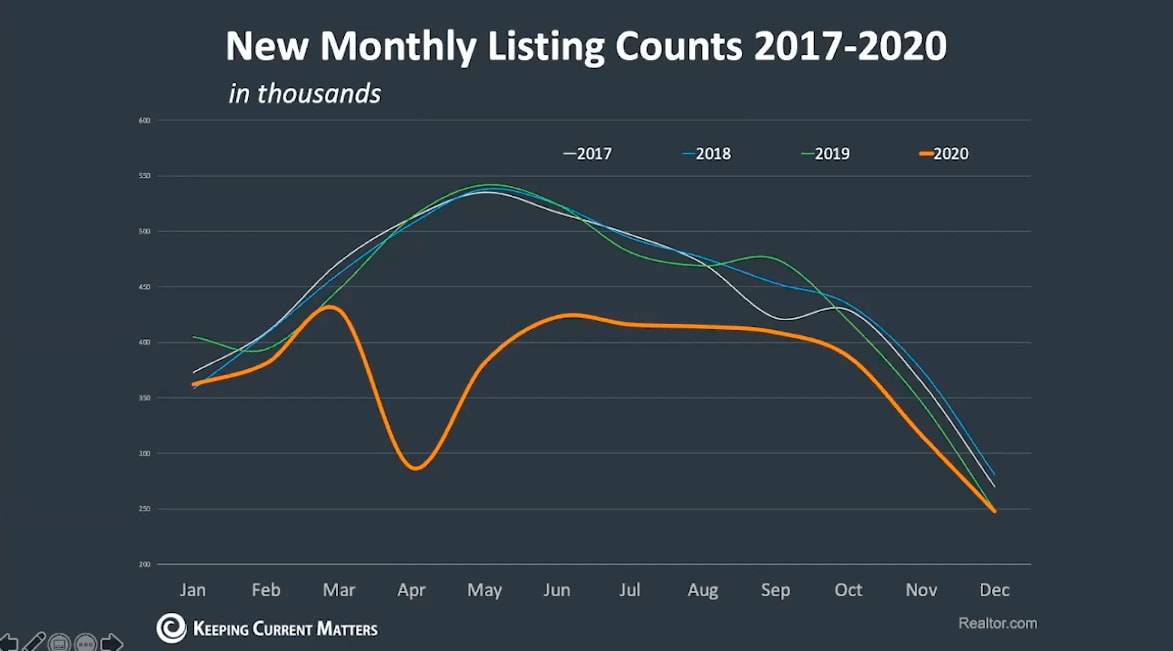
Line chart comparing monthly listing counts from 2017 to 2020, with a sharp drop in April 2020.

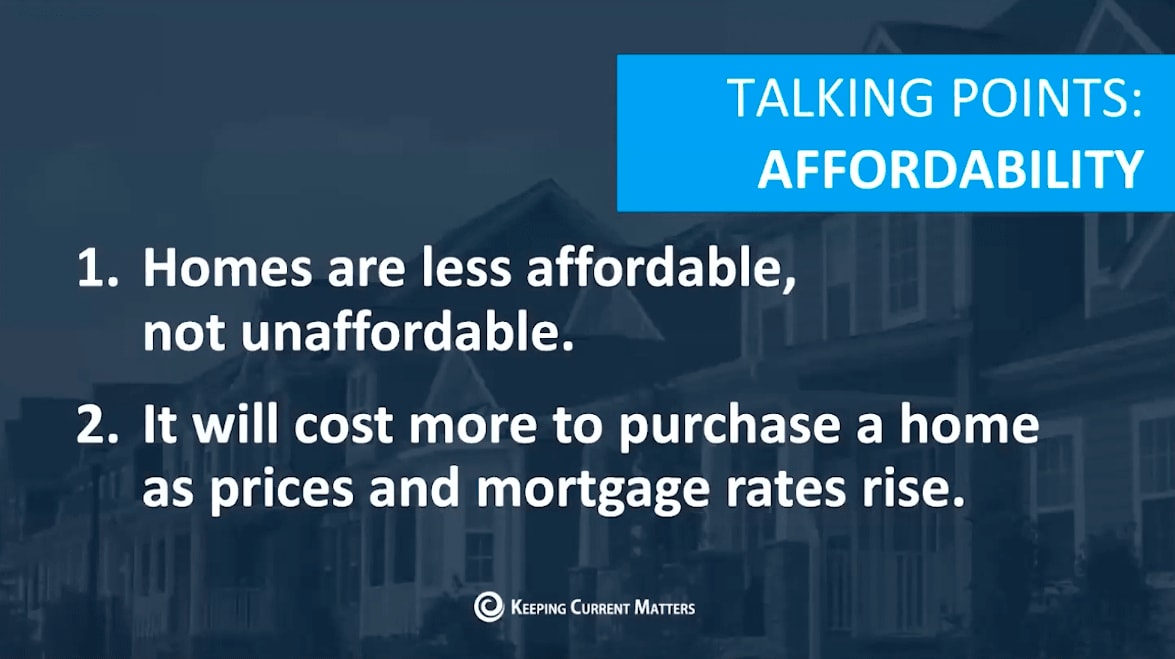
Affordability talking points: homes are less affordable, and rising prices and mortgage rates increase the cost of buying.

Chart compares mortgage payments as a share of income: NAR guidance 25%, historical average 21.2%, today 15.1%.

Quote graphic explaining the 25% mortgage payment-to-income guideline and 30% limit for total housing expenses.

Homebuying budget guide quoting Freddie Mac’s recommendation to limit mortgage payments to 28% of gross monthly income.

Chart of income needed for mortgage payments, showing 15.1% in August 2021 versus a historic norm of 21.2%.

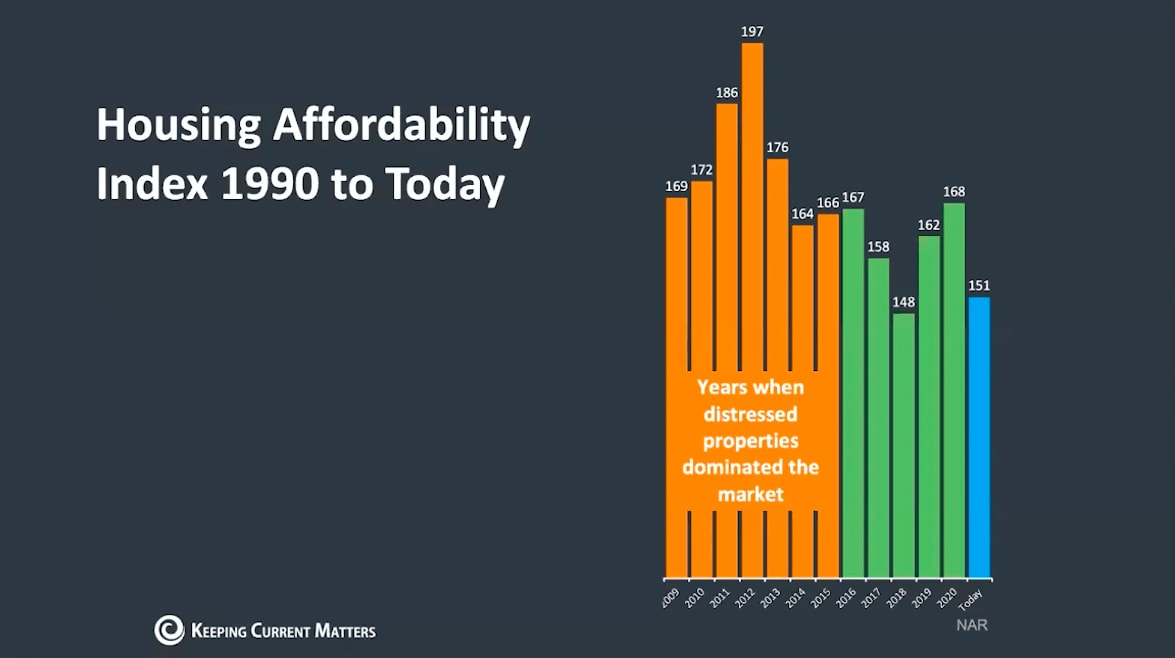
Housing affordability index chart with annual values from 2009 to today and distressed-market years highlighted.

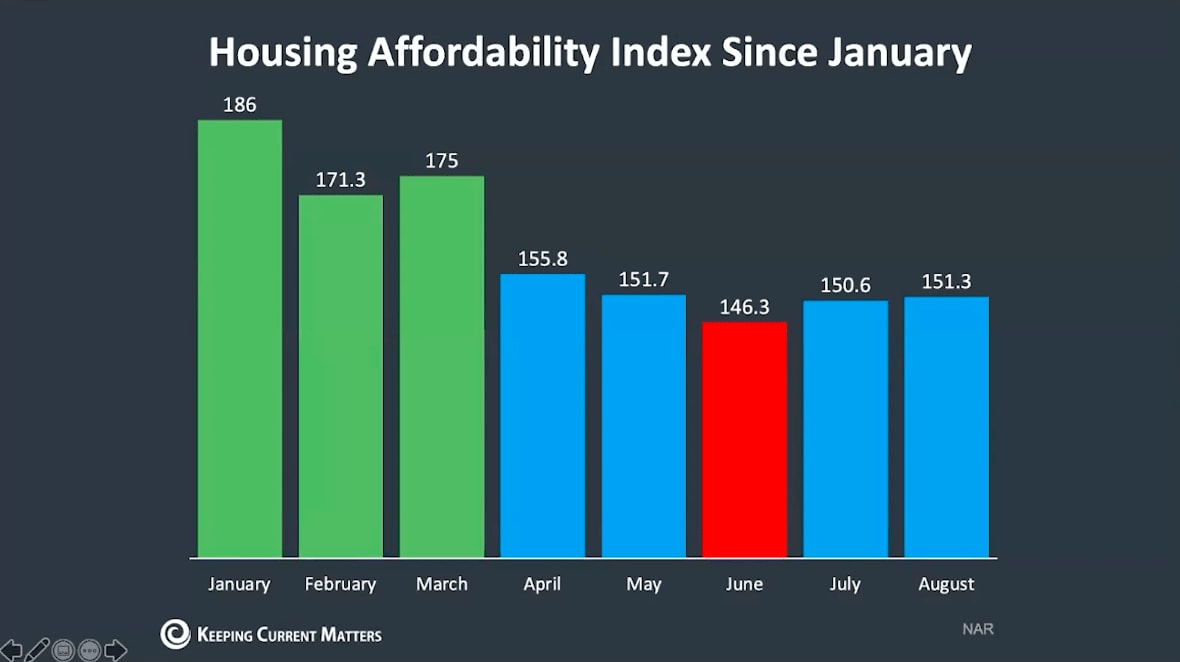
Housing Affordability Index falls from 186 in January to 151.3 in August, with a June low of 146.3.

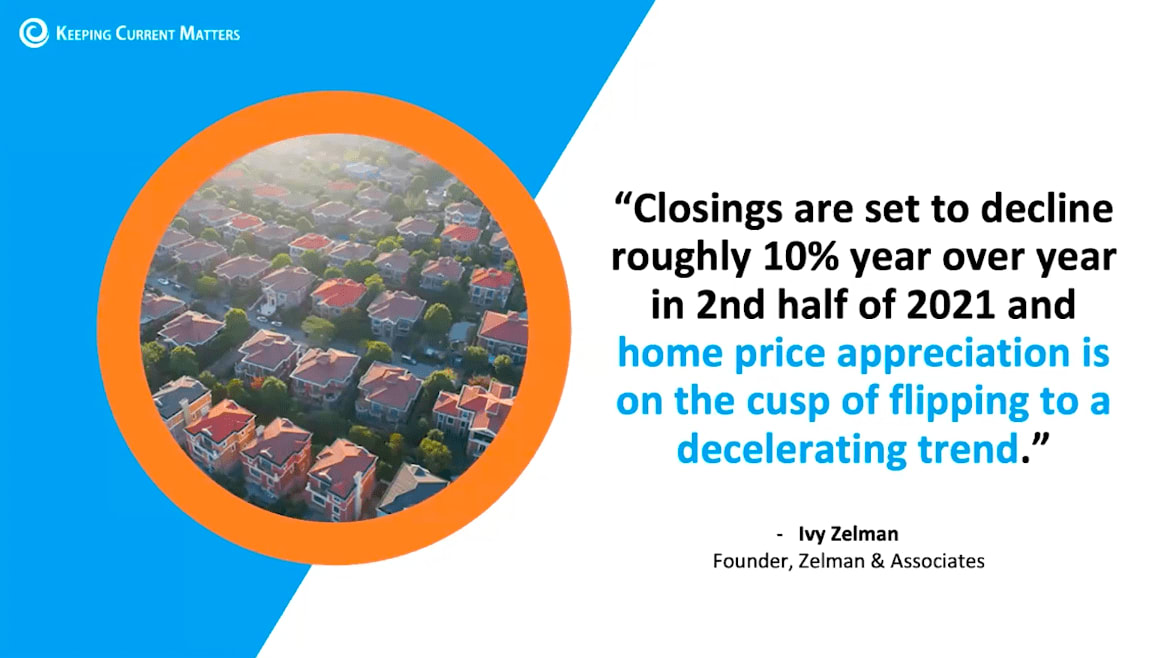
Real estate market graphic quoting Ivy Zelman on home closings and price appreciation.

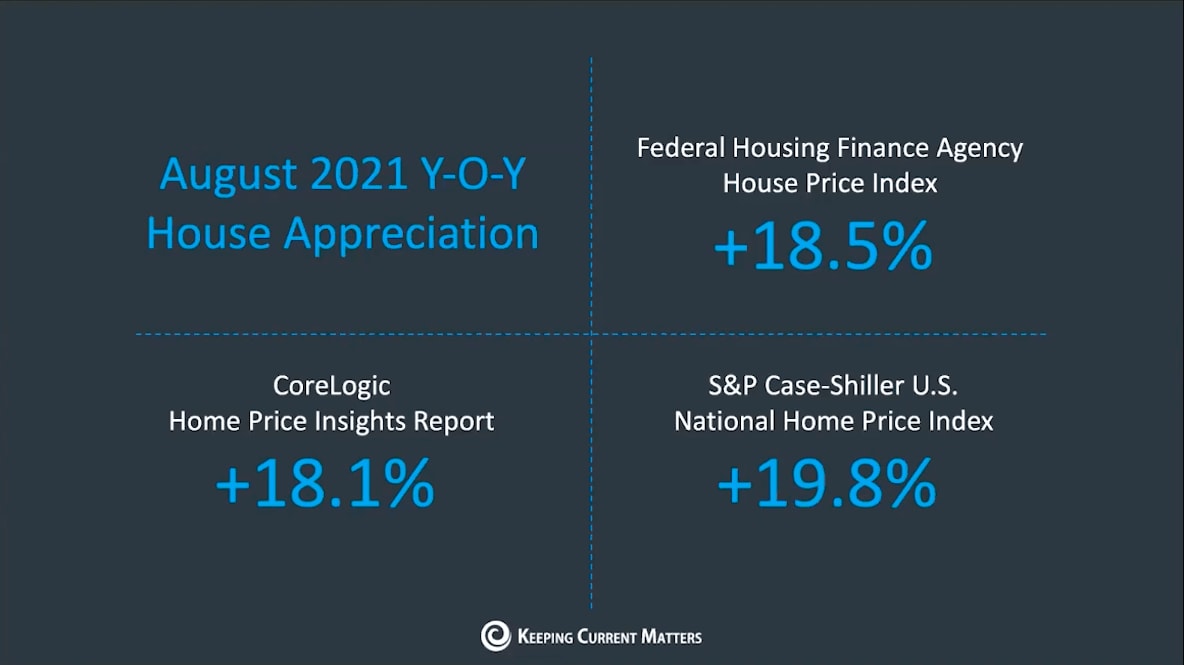
August 2021 home price appreciation: FHFA 18.5%, CoreLogic 18.1%, and S&P Case-Shiller 19.8%.


Work With Us

We make it our business to get to know our clients, to learn not only what they are looking for, but also the whys behind that desire.
Contact Us
Follow Us